
Introduction, Concepts, Terminology of Auctiondashboard Orderflow Tool
1.On the Chart


1. On the Chart
1.1. Default Shortcut
2. Flow of Events
3. Text Display
4. Real Time Data Sensitivity
5. BackFill and Reconstruction
6. TPO Reconstruction
7. How We Refer to Volume
8. What is Aggressor Absorption™?
9. What is True Auction™ Balance?
9.1 Brief Example
9.2 Display Changes; and Indications
10 Volume Text Displays; and Profile Displays
11 Extra: Where to Find Aggressor Absorption™
11.1 Inside Auction Cum Volumes
11.2 Inside Auction Deltas
11.3 Bars
11.4 Session Profiles
11.5 Cum Aggressor Absorption™ Delta

Bar :The bars capture all of the Aggressor Absorption™ price by price. The absorption markers on the bars can be tuned to appear when the absorbers begin to kick in with more volume compared to the aggressors. Again, you'll reveal where activity is higher (remember that Aggressor Absorption™ is a measure of trader activity).

Two Display Modes
Auction Dashboard™ provides two display modes for the bars: "normal display", and our True Auction™ Value bars.
Normal Display
In normal display, the bars have a body like a candlestick: the body outlines the open and close prices, and is colored green for up-candles, and red for down-candles (the body is white for neutral "dojis" or "spinning tops")


True Auction™ Value Display
In True Auction™ Value display, the body outlines the True Auction™ Value area: it doesn't correlate with the candle's open or close. The displayed value area is the True Auction™ Value area; and the color of the body reflects the delta within the value area — green for up-delta, red for down-delta, and white if neutral. Note that this delta is only within the True Auction Value area: it may not correlate with the bar's total delta.

The Momentum Delta
The Momentum Delta follows the development price by price from a delta perspective. It is tuned to give you a delta that strongly follows the current power position and shows you momentum.


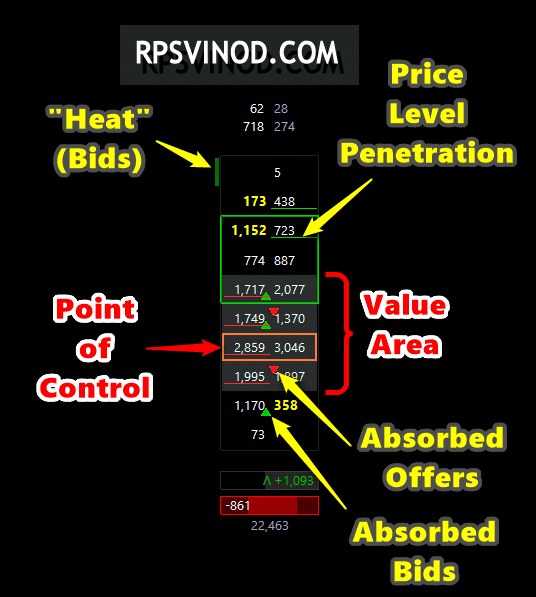
What is Aggressor Absorption™?
Traders are familiar with at least one concept of Absorption: when selling has peaked to a low support zone, C.O.'s may begin to buy and accumulate, absorbing any further selling. They want to get the best price, so they absorb in the narrowest and lowest support range that they can. The effect is that price stays at that low, even as volume enters the market, and the buyers accumulate and absorb. So the two aspects here are: halted price, and buyers actively opposing sellers. Note that the absorbers may do so with bids, and also with buying.
Aggressor Absorption™ has a narrower definition. First, it only ever measures Limit Order information; not Market Trading. And importantly, it is measured bid-by-bid, and offer-by-offer. It is not a parallel to the above. It is defined this way: given some individual bid or offer depth shown to the market, and one or more traders accepting that bid or offer; then if other bids or offers add into that bid or offer, and those adding traders do execute against the aggressors, then those adding traders are what we term Aggressor Absorption™. They add into the current bid or offer, and do ultimately get executed by an aggressor. Therefore, they are "absorbing" the printed volume there. Adding bids would be termed "Absorbed Bids", and adding offers "Absorbed Offers".
And so, restating: Aggressor Absorption™ is the activity of bids and offers tailing into the current bid or offer, and ultimately in fact absorbing some buyer or seller.
There are many aspects to this volume that may not be readily apparent to the trader who is not thinking from an academic point of view.
When Aggressor Absorption™ is displayed on the chart, we consider absorbed bids to be like buy volume; and absorbed offers like sell volume: by which we only mean that in a display, absorbed bids will appear where buy volume would appear; and absorbed offers appear where sell volume would appear. There is at least one case where there is a reverse: in Composite Volume Profiles, the Level-1 display is reversed overall; yet the absorbed offers are still colored as sell volume, and absorbed bids are still colored as buy volume (the entire Level-1 display in the composite plots in reverse since it accompanies a volume display; but the representation is still obvious).
Overview of the Dashboard


1 It Is One Cohesive Dashboard
2 Inside Auction and Level-II
Contents
1 It Is One Cohesive Dashboard
2 Inside Auction and Level-II
3 Layers In the Middle
4 Bars
5 True Auction™ History and Transition Zones™
6 Session Profiles
7 Accumulated Volumes and Deltas
8 Markers and Alerts